The Corruption Perceptions Index 2013 serves as a reminder that the abuse of power, secret dealings and bribery continue to ravage societies around the world.
The Index scores 177 countries and territories on a scale from 0 (highly corrupt) to 100 (very clean). No country has a perfect score, and two-thirds of countries score below 50. This indicates a serious, worldwide corruption problem. Hover on the map above to see how your country fares.
The world urgently needs a renewed effort to crack down on money laundering, clean up political finance, pursue the return of stolen assets and build more transparent public institutions.
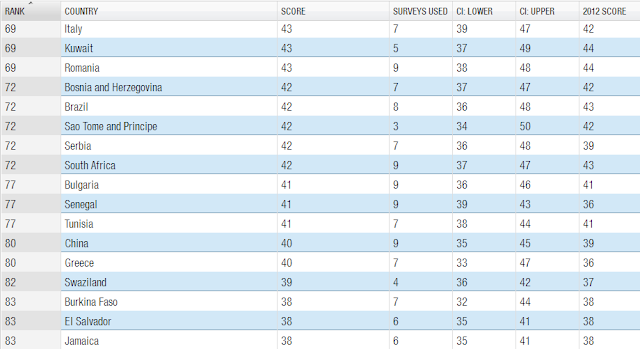
The Corruption Perceptions Index ranks countries and territories based on how corrupt their public sector is perceived to be. A country or territory’s score indicates the perceived level of public sector corruption on a scale of 0 - 100, where 0 means that a country is perceived as highly corrupt and 100 means it is perceived as very clean. A country's rank indicates its position relative to the other countries and territories included in the index. This year's index includes 177 countries and territories.
Full table and rankings
In the table above, CI refers to Confidence Interval. The confidence interval reflects some of the uncertainty associated with a country's CPI score. It is calculated by looking at the range of scores given by all the data used to calculate that country's score, such that a wider interval reflects a wider variation in the data for that country. For more information on the CPI methodology and data sources, download our CPI information package.
Source: Transparency.org


No comments:
Post a Comment